Proxy Score Explained
Each forwarded link in your network holds a quality grade that gets ignored more often than not. A proxy score reflects the real-world reliability, speed and reputation of any IP you route traffic through. This metric shapes your request stability, response speed and the odds of running into blocks. Many professionals in digital marketing and automation overlook it, then wonder why their workflows break. Without this data point, you're essentially gambling on whether your next batch of requests goes through or crashes. Understanding this number is one of the simplest ways to boost your success rate optimization when working with proxies for any lawful purpose in the US.
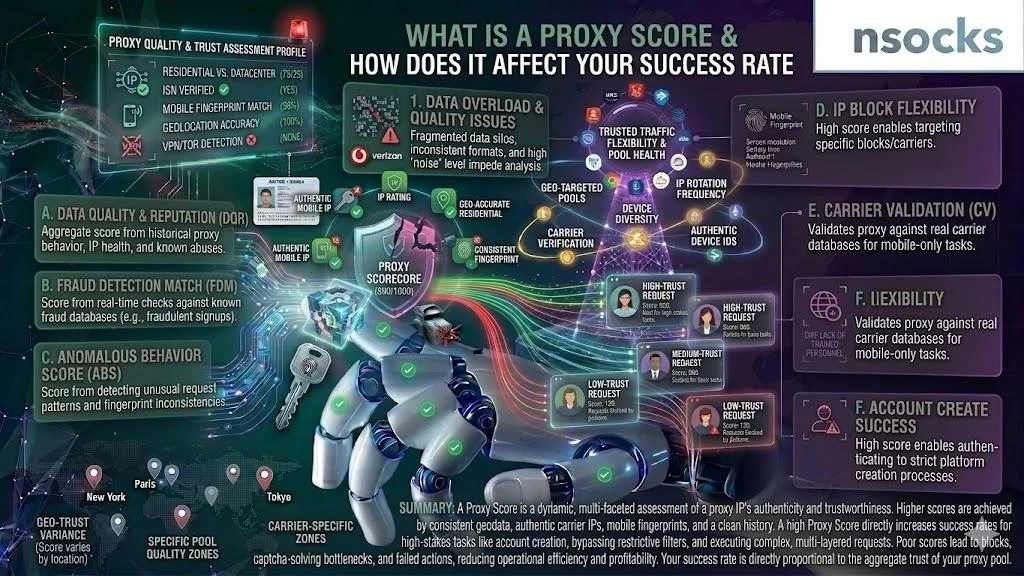
🧠 Understanding what a proxy score is
Before choosing a provider, you need to understand what this rating actually communicates about your IPs. Think of it as a health grade for your connection. Providers like Nsocks assign this metric to help users make smarter decisions about which IPs to route traffic through. The concept itself isn't complicated, but the way it gets calculated varies across the industry.
📌 Definition and core concept of proxy score
Each IP gets a numerical grade built from actual uptime records, response behavior and reputation across the web. It typically runs on a scale from 0 to 100, where higher means better quality. The rating aggregates data like uptime history, response latency, geographic consistency and whether the IP has been flagged by blacklists. Services such as IPQualityScore generate these ratings by cross-referencing billions of data points. Most professional users treat this number as the single most important filter when selecting IPs for production workloads.
💡 How proxy scoring systems evaluate quality: Scoring systems pull data from multiple layers. The system sends test requests to every connection point on a set schedule, recording how fast it answers. They check if the IP appears on known spam or abuse databases. They verify geographic location consistency. Some advanced systems also track how often requests through that IP get CAPTCHAs or blocks. All of this feeds into one composite number. The more data points the system collects, the more accurate the final rating becomes over time.
📊 What factors influence proxy score
No single variable decides the rating. A combination of technical and reputational factors comes together. Providers weigh each factor differently, but the core inputs stay consistent across the industry. Knowing these factors lets you predict how an IP will perform before committing it to a live workflow.
| Factor | What it measures | Impact on score |
|---|---|---|
| ⏱️ Latency | Response delay in milliseconds | High latency drops the rating fast |
| 🟢 Uptime | Percentage of time the IP stays reachable | Drop under 95% and the grade craters |
| 🛡️ IP reputation | Blacklist presence, abuse history | Blacklisted IPs land at the bottom of the scale |
| 🌍 Geo stability | Consistency of reported location | Shifting locations reduce trust |
| 🔄 Request success rate | Ratio of completed vs failed requests | Poor completion rate drags the number down |
An ip score check runs these parameters in real time. If any single factor degrades sharply, the overall rating follows.
🏢 Why proxy providers use scoring systems
Providers need a fast way to communicate quality to their customers. Listing raw data for every IP would overwhelm anyone. Condensing it all into one rating cuts decision time in half. It also helps providers manage their own infrastructure: low-scoring IPs get rotated out or cleaned up. For Nsocks, this system ensures that users always have access to IPs that meet a minimum quality threshold. A scamalytics ip check works on a similar principle, flagging suspicious connections before they cause damage. From a business perspective, scoring also reduces support tickets because users can self-select IPs that match their task requirements.
⚡ How proxy score affects performance and success rate
This is where theory meets real impact. Your proxy performance indicators directly depend on the rating of the IPs you use. A gap of just 20 points on the scoring scale can mean the difference between a smooth campaign and hours of debugging failed requests.
🔗 Connection stability and request success
A well-graded node keeps the link alive with no surprise interruptions. Your automated workflows, data collection scripts or API calls complete without interruption. Low-rated proxies disconnect mid-request, force retries and pile up timeout errors. For anyone running marketing analytics in the US market, even a 2% drop in connection stability score translates to lost data. Consistent connections also reduce the risk of partial data captures that corrupt downstream analysis.
🚀 Speed and latency impact
Speed isn't just about comfort. Slow proxies bottleneck your entire pipeline. When you send 10,000 requests and each takes an extra 200ms, you lose over 30 minutes of processing time. At scale, that delay compounds into missed deadlines and wasted compute resources. An ip reputation score directly correlates with these latency patterns.
| Metric | High score (85+) | Low score (below 40) |
|---|---|---|
| ⏱️ Avg. latency | 50–120 ms | 400–1200 ms |
| ✅ Request success | 97–99.5% | 60–78% |
| 🔁 Retry rate | Under 2% | 15–30% |
| 💰 Cost per successful request | ~$0.001 | ~$0.006+ |
The cost difference alone justifies paying attention to this metric.
❌ Error rates and request failures
Any node graded under 40 will throw 403 blocks, CAPTCHA challenges and dropped connections on a regular basis. Target servers detect low-quality IPs through their own traffic quality signals and block them preemptively. A fraud score ip rating works the same way on the receiving end. The pattern tends to snowball: once an IP gets flagged by one major platform, others follow within hours.
💡 How to interpret failure patterns: Track error logs by individual IP. When a single IP fires back 403 or 429 codes repeatedly, its grade has tanked. Swap it out without waiting. Most professional setups automate this using threshold-based rotation rules. Logging these patterns over a week or two also helps you identify which target domains are strictest about IP quality.
🧮 How proxy score is calculated in modern systems
The calculation isn't a mystery, but it varies between providers. Understanding the logic behind it gives you an edge when comparing options and negotiating for better IP pools.

🔧 Technical parameters behind scoring
Three pillars drive the calculation: latency, uptime and IP cleanliness. The system measures latency through periodic pings from multiple geographic points. Providers track uptime over rolling 24-hour and 7-day windows. IP cleanliness comes from cross-referencing blacklist databases. An ip quality check typically covers all three at once. Some providers also factor in SSL handshake speed and DNS resolution time as secondary signals.
📈 Behavioral signals and usage history
The way you route traffic loops back into every IP's quality number. If you push excessive requests through a single IP and it gets flagged, that IP's rating drops. Providers track request volume, target diversity and error patterns. An IP that handles varied, moderate traffic rates higher than one hammered with aggressive bursts. Spreading your requests across multiple IPs preserves each individual IP's behavioral profile and keeps ratings stable.
- 🔄 Provider pings each IP from multiple locations
- 📊 System logs latency, packet loss and uptime
- 🛡️ IP checked against 50+ blacklist databases
- 📍 Geographic consistency verified over 24 hours
- 🎯 Overall number lands somewhere on a 0–100 scale
🔀 Differences between providers
There's no universal standard. Each provider weights factors differently based on their network type and audience. What one platform considers a top-tier IP might rank as mid-range elsewhere.
| Aspect | Provider A approach | Provider B approach | Nsocks approach |
|---|---|---|---|
| Scale | 0–100 | 1–10 | 0–100 |
| Primary weight | Latency | IP reputation | Balanced composite |
| Update frequency | Hourly | Daily | Real-time |
| Transparency | Limited | Moderate | Full dashboard access |
This lack of standardization is why you should always test IPs in your own environment rather than relying purely on listed ratings. A check ip score from one provider doesn't translate directly to another.
📊 Types of proxy scores and what they mean
Quality grades spread across a wide range, and each tier tells a different story. Once you know an IP's grade, you can slot it into the workflow it actually fits. Mismatching a low-tier IP with a high-stakes task is one of the most common and expensive mistakes in the field.
High-quality proxy score (80–100): These IPs show under 100ms latency, 99%+ uptime and zero blacklist flags. Best for production systems and API integrations. The proxy quality rating on these connections rarely fluctuates even under sustained load.
Medium-level proxy score (50–79): Acceptable for testing and non-critical tasks. Latency sits between 150–350ms. Occasional timeouts stay under 5%. These work well when you need volume over precision and can tolerate some retry overhead.
Low-quality proxy score (below 50): Unreliable for anything beyond throwaway experiments. Frequent blocks, high latency and geographic inconsistency make these IPs a liability in any serious workflow.
✅ Advantages of high-score proxies:
- 🟢 Near-zero downtime during critical operations
- 🟢 Predictable latency for time-sensitive requests
- 🟢 Clean IPs that bypass most automated filters
- 🟢 Lower total cost per successful request
❌ Limitations to consider:
- 🔴 Higher upfront price per IP
- 🔴 Limited availability in some geographic regions
- 🔴 Numbers slide fast if you skip rotation under heavy load
Seeing 75 on the dashboard doesn't translate to a 75% completion rate. The relationship is nonlinear. IPs above 80 perform exponentially better than those between 50 and 70. The sweet spot for US-based marketing and automation sits above 85. Anything below 50 should be treated as disposable and never assigned to revenue-critical operations.
💼 How proxy score impacts business workflows
US-based companies running lawful digital operations feel every dip in connection quality on their balance sheet. The connection between your IP pool's rating and your operational costs is tighter than most teams realize until they run the numbers.
📢 Marketing and data automation use cases
Ad verification teams need clean IPs to check campaign displays across regions. Market researchers pull pricing data from public websites. Each task demands network reliability metrics you'll only get from high-grade connections. An ip risk score below 40 gets requests blocked by most major advertising platforms. Teams that ignore this end up with incomplete datasets and skewed analytics reports.
🔌 API integrations and reliability
When your system relies on third-party APIs, every failed request cascades. Rate limits kick in faster when servers detect poor-quality IPs. A stable ip trustworthiness evaluation keeps API calls flowing without triggering defensive endpoint responses. For SaaS platforms that depend on external data feeds, even brief disruptions cause downstream failures across multiple services.
💰 Cost efficiency and resource optimization
Cheap proxies cost more in the long run. Numbers for a typical 100,000-request campaign tell the full story. The upfront savings evaporate once you account for failed retries, wasted bandwidth and the operator time spent troubleshooting.
| Metric | High-score proxies ($) | Low-score proxies ($) |
|---|---|---|
| 💵 Proxy cost | $50 | $15 |
| 🔁 Wasted retries (bandwidth) | $2 | $28 |
| ⏱️ Time lost (operator hours) | $10 | $85 |
| 💸 Total effective cost | $62 | $128 |
The ip trust score you start with determines the total bill you end up paying.
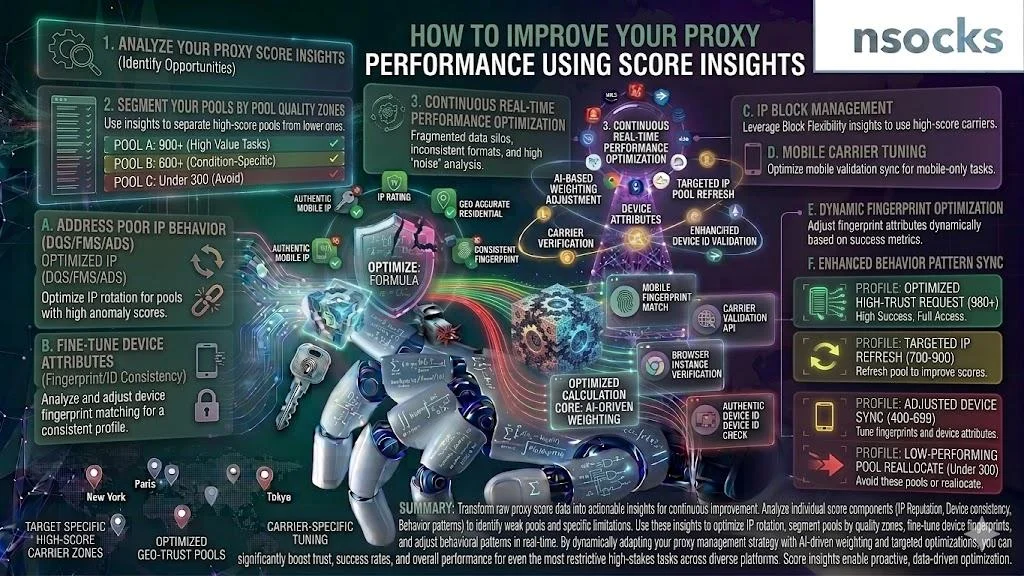
🛠️ How to improve your proxy performance using score insights
Good data leads to better decisions.Turning rating data into action takes no guesswork once you know the key signals. The goal is to build a system that self-corrects by dropping bad IPs and promoting good ones automatically.
✅ Choosing high-score proxy providers
Look for providers that offer transparent scoring dashboards, real-time monitoring and IP rotation options. Nsocks provides all three for US-based users. Ask whether the provider runs their own proxy detection risk checks before assigning IPs to customers. Residential IPs from reputable sources typically start with higher baseline grades than datacenter alternatives. Also verify that the provider updates ratings frequently. Stale numbers from a weekly refresh are almost as bad as no data at all.
📡 Monitoring proxy performance over time
Nothing stays fixed on the quality scale. An IP that rated 90 last week might drop to 65 after getting flagged. Set up automated monitoring that tracks performance per IP over time. Create alerts for any IP that falls below your minimum threshold. Weekly reviews of trending data help you spot slow degradation before it turns into a full-blown outage.
⚖️ Optimizing request distribution
Pushing all requests through a single node is asking for trouble. Distribute traffic among several high-grade connections. This keeps individual IPs from getting burned and maintains your overall connection trust level with target servers. Use round-robin or weighted routing tied to real-time grades. That's how you balance speed against burning through your IP inventory.
- 🎯 Lock in a floor for your minimum acceptable IP grade (recommended: 80+)
- 📋 Pull current ratings for all IPs in your pool
- 🗑️ Remove any IP scoring below 50
- ⚖️ Distribute load evenly across remaining IPs
- 📊 Monitor weekly and rotate degraded IPs immediately
Rotate IPs proactively, not reactively. Run periodic grade checks through the provider's API on a fixed schedule. Keep a buffer pool of backup IPs ready. Document your threshold rules so anyone on your team can maintain the system without guessing at acceptable limits.
⚠️ Common mistakes when ignoring proxy score
Skipping this metric creates predictable problems. Most of them are avoidable with basic monitoring and IP selection discipline.
- ❌ Using low-quality proxies for critical tasks - production systems need reliability. One bad IP can corrupt an entire data pipeline or trigger account flags.
- ❌No performance monitoring means no visibility when quality drops. What worked last month might fail today. Without tracking, you're flying blind.
- ❌ Overloading a single IP source. Fire thousands of requests through one address and its quality number drops within hours. Target servers notice the pattern and block it.
These mistakes cost US businesses thousands of dollars monthly in wasted resources and failed campaigns. The fix starts with checking your what is ip reputation status before committing any IP to production use.
📋 Proxy score comparison table
A fast lookup for pairing connection grades with the right workload across three performance levels. Use this as a starting point when deciding which IPs to assign to different parts of your workflow.
| Attribute | 🟢 High (80–100) | 🟡 Medium (50–79) | 🔴 Low (below 50) |
|---|---|---|---|
| ⏱️ Speed | 50–120 ms | 150–350 ms | 400–1200+ ms |
| 🔒 Stability | 99%+ uptime | 92–98% uptime | Below 90% |
| ❌ Error rate | Under 1% | 3–8% | 15–40% |
| 💰 Cost/IP (monthly) | $3–$8 | $1–$3 | Under $1 |
| 🎯 Best use | Production, APIs, marketing | Testing, non-critical scraping | Throwaway experiments only |
🌐 Real-world performance scenarios
Theory only goes so far. Each case shows what happens when IP quality tiers collide with real workloads. These mirror what US-based teams actually encounter when routing requests through commercial IP networks for legal use.
✅ Stable high-score proxy in production systems
A US-based ad verification company routes 500,000 daily checks through Nsocks proxies scoring above 90. Completion rate holds at 98.7% with 85ms average latency. The monthly bill for the IP pool sits at $400, with less than $15 lost to retries. Everything hums along for weeks without manual intervention because the connection grade holds steady. Engineering time freed up from debugging gets redirected to feature development instead.
🟡 Medium-score proxy in testing environments
A development team uses medium-rated proxies (score 60–75) for staging tests. Latency averages 220ms with about 5% request failure, acceptable for verifying logic. Monthly spend: $80. They'd never push these to production, but for development the tradeoff works. The lower cost also means they can spin up test environments without needing budget approval every time.
🔴 Low-score proxy and failure cases
A small operator runs data collection through bargain proxies scoring 25–40. Within two days, 35% of target sites block the IPs. What follows is twelve hours of manual debugging. The damage: $340 in labor and another $45 in connection costs. Running the identical task on high-grade connections would have totaled $90. This is the kind of false economy that quietly drains budgets month after month.
| Scenario | Score range | Success rate | Monthly cost | Operator time |
|---|---|---|---|---|
| 🟢 Production (ad verification) | 85–95 | 98.7% | $400 | Minimal |
| 🟡 Testing (staging env) | 60–75 | 95% | $80 | Low |
| 🔴 Budget attempt | 25–40 | 65% | $385 (incl. labor) | High |
❓ Frequently asked questions
What is a good proxy score?
Anything above 80 works well for most production and automation tasks.
Does proxy score affect speed?
Yes, lower-rated proxies consistently show higher latency and slower response times.
Can proxy score change over time?
Ratings fluctuate based on usage patterns, blacklist updates and network conditions.
How can I check proxy score?
Most providers offer dashboards or API endpoints that display real-time ratings for each IP.
Is high proxy score always better?
When it matters, absolutely. For quick throwaway tests, mid-level ratings stretch the budget without real downsides.